Introduction
This blog is about world happiness ladder using the world happiness report data sets (Helliwell et. al., 2024). The basic objective is to demonstrate the use of panel data which is quite distinct from cross-sectional or time series data.
Global happiness ladder
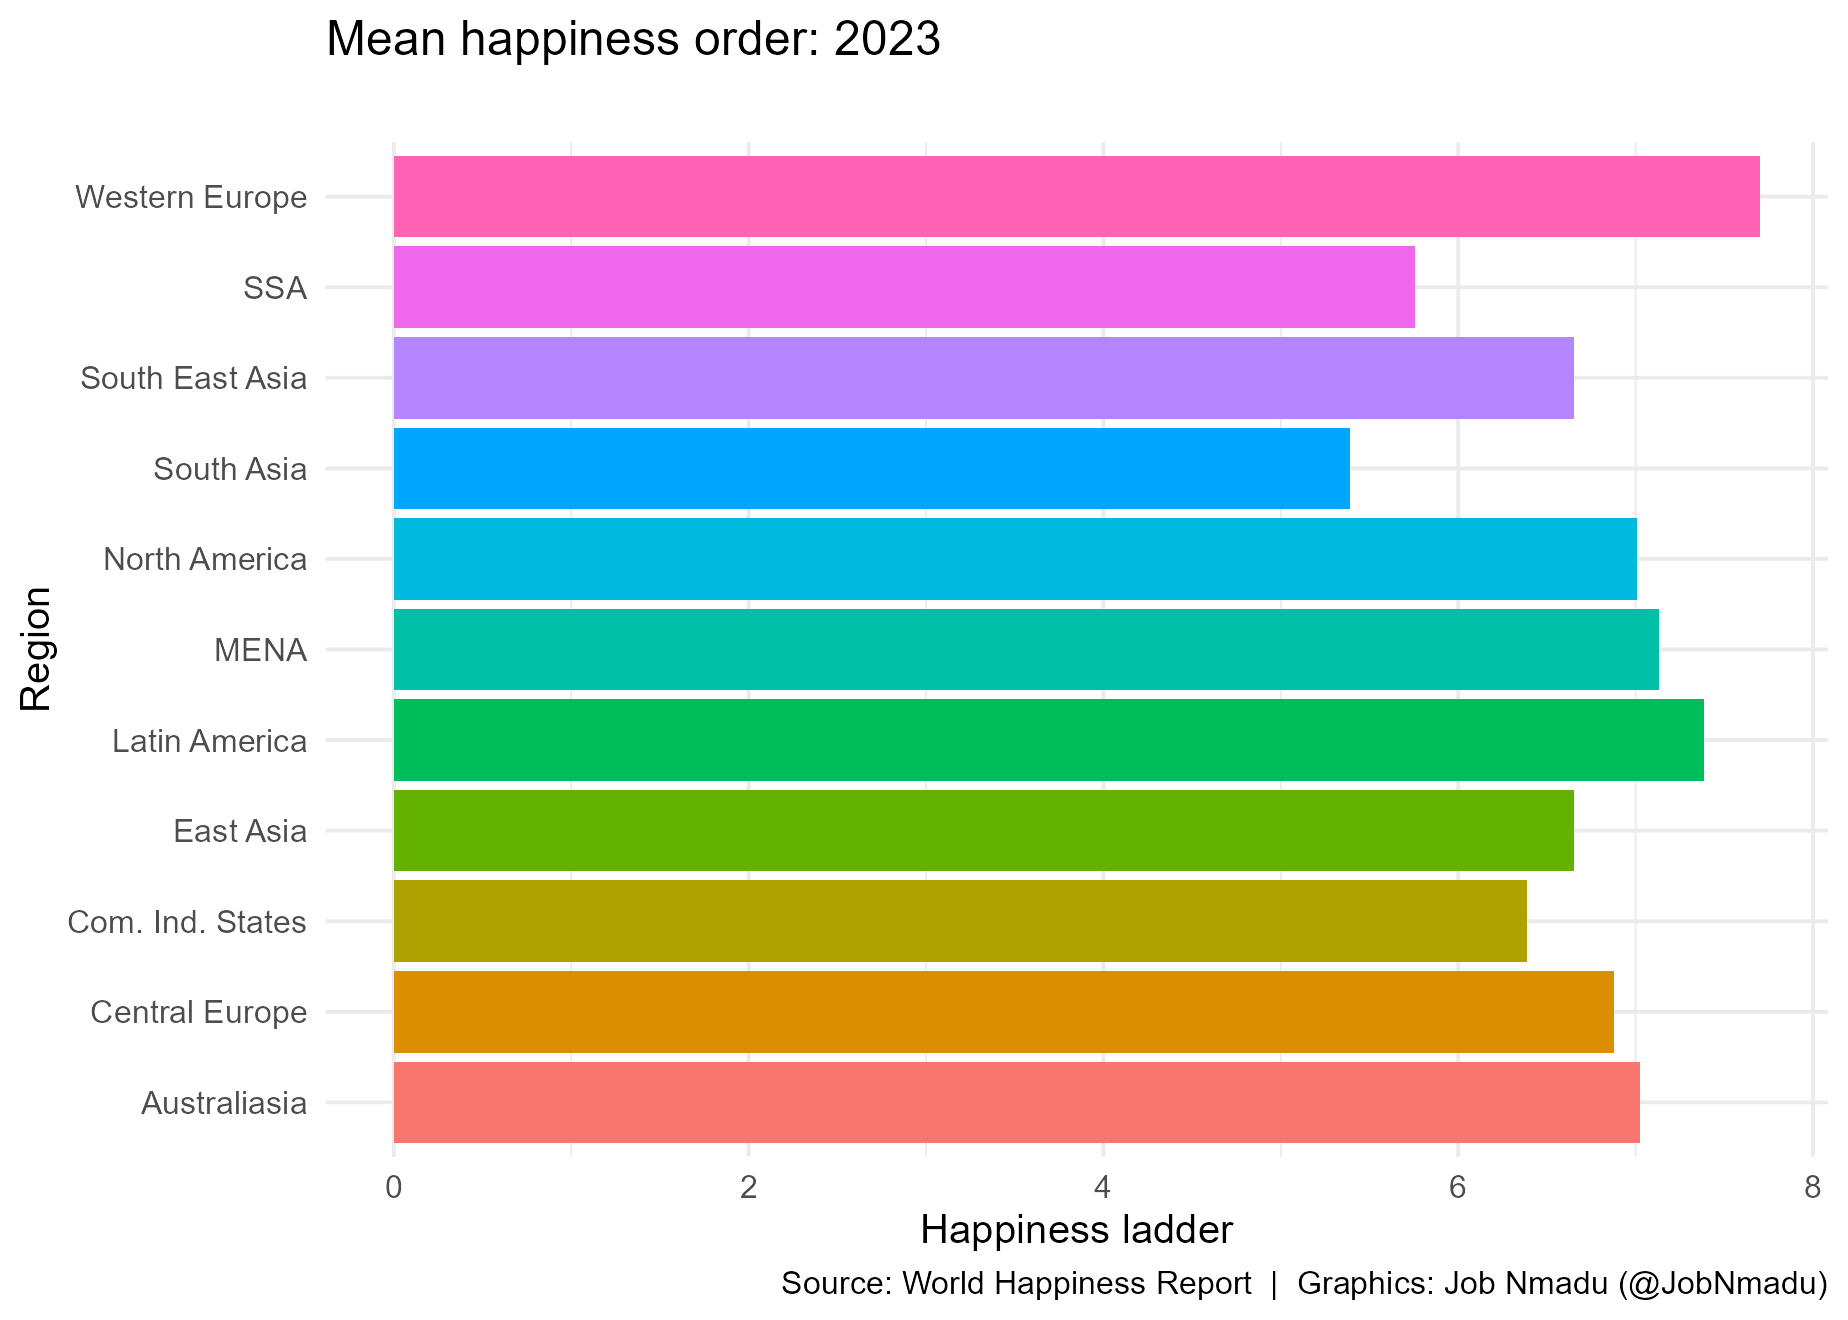
Cross-sectional happiness ladder for 2023

Fixed time, it is cross-sectional
Times series vs. panel data visualisation
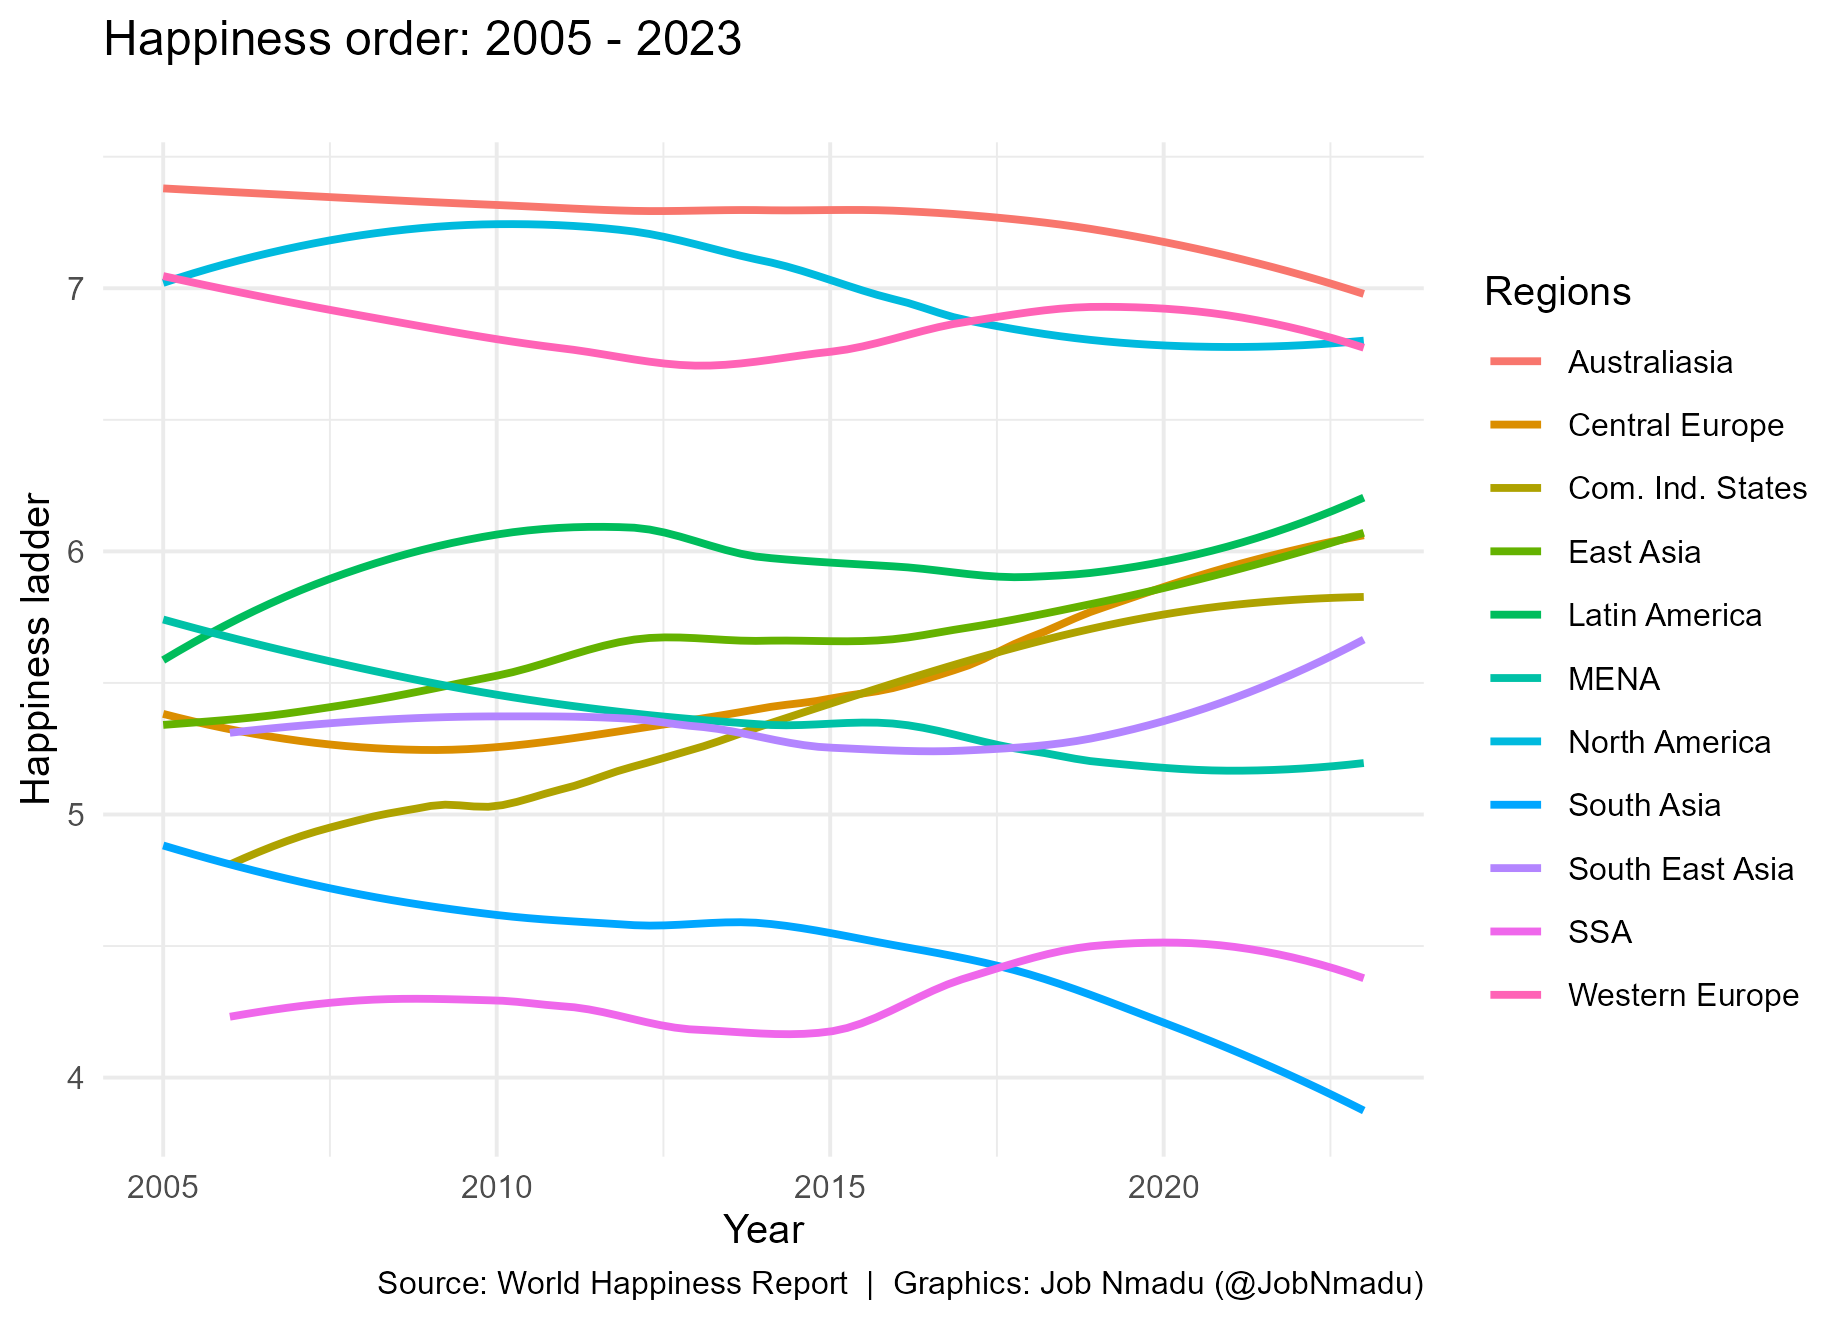
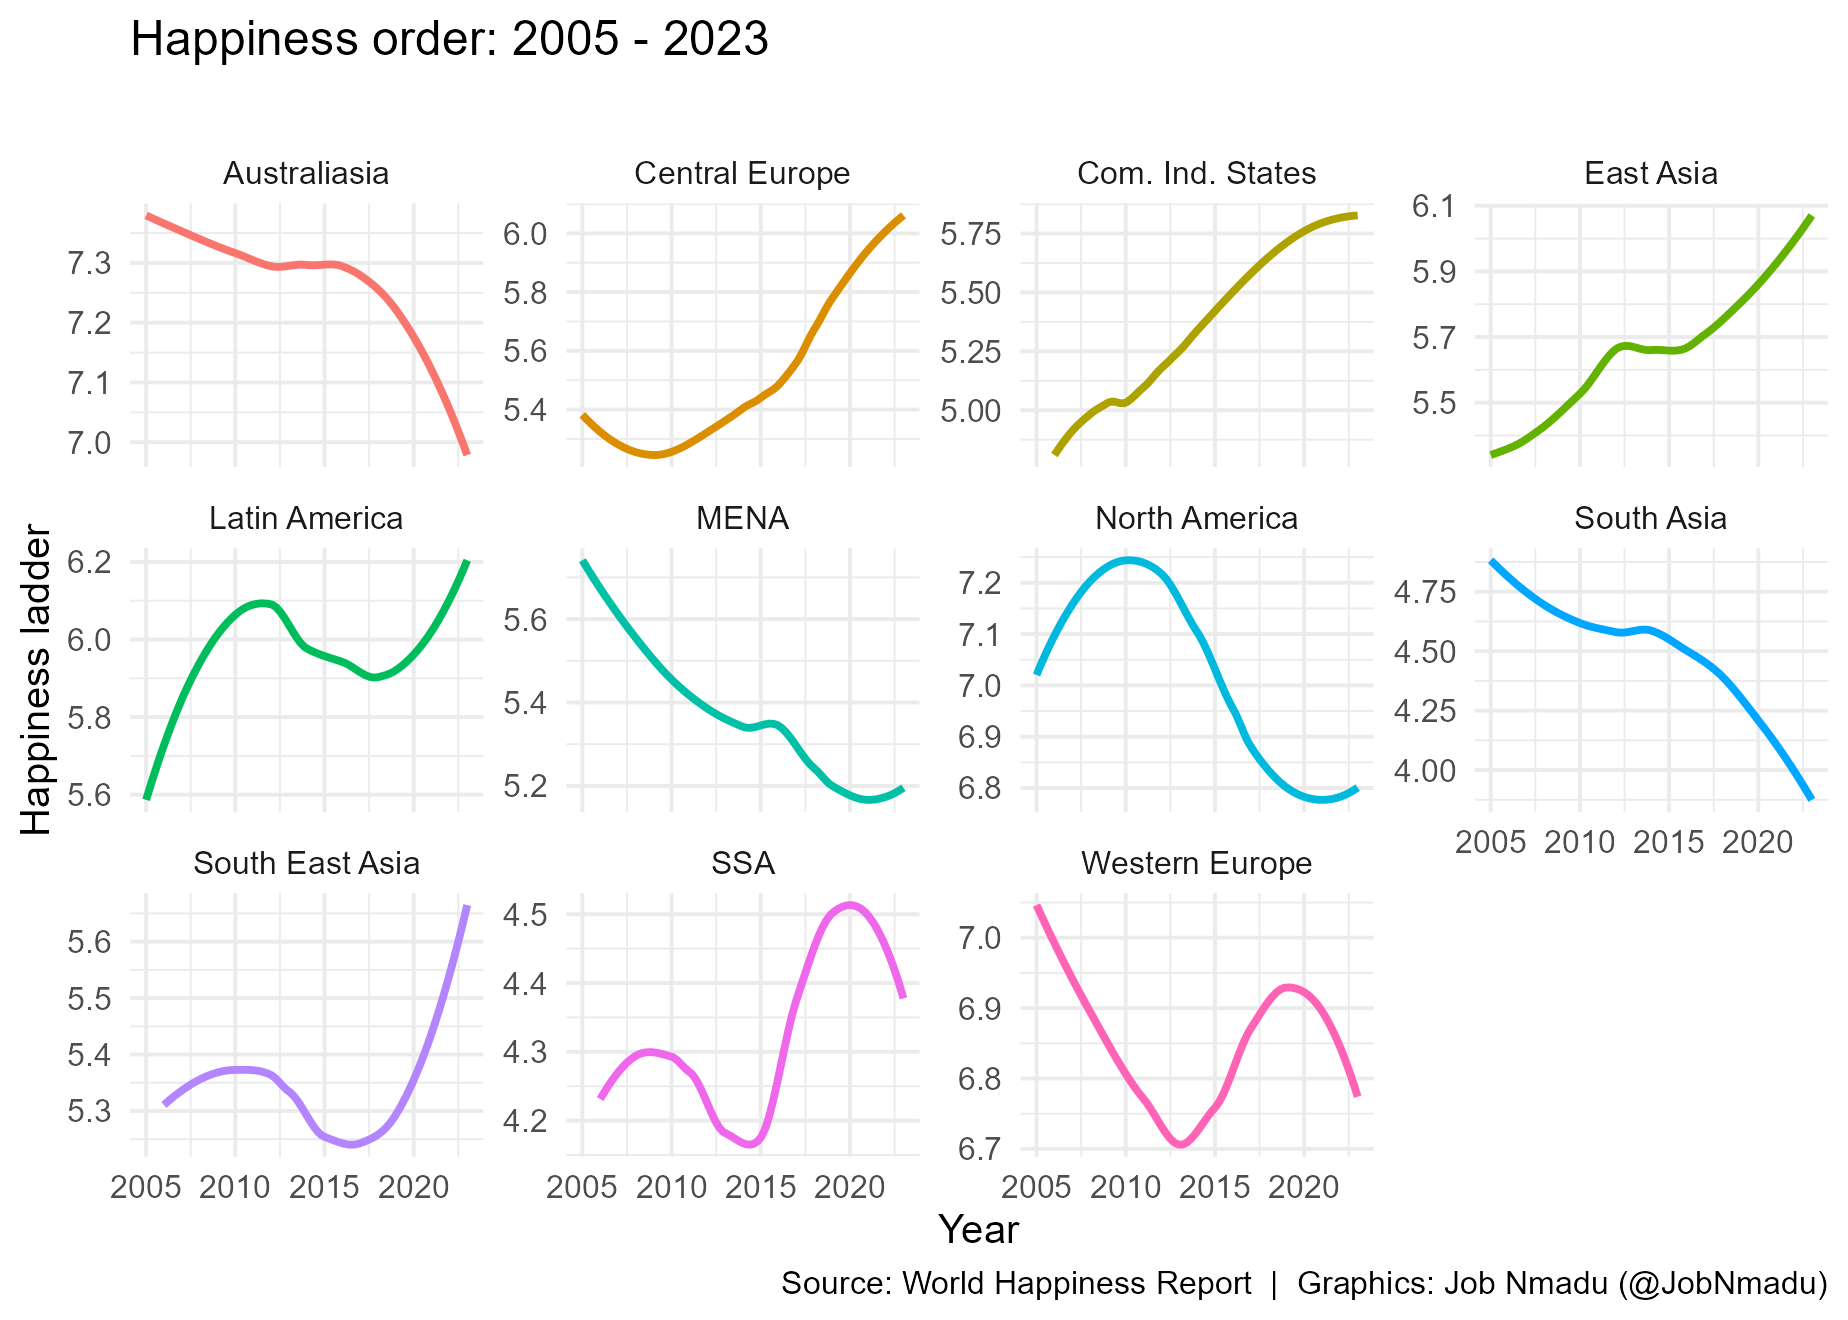
Each line is a timeseries but together, it is panel data
Mean global happiness lalder
Cross-sectional mean happiness ladder for 2023
Time is fixed, cross-sectional
Times series vs. panel data visualisation
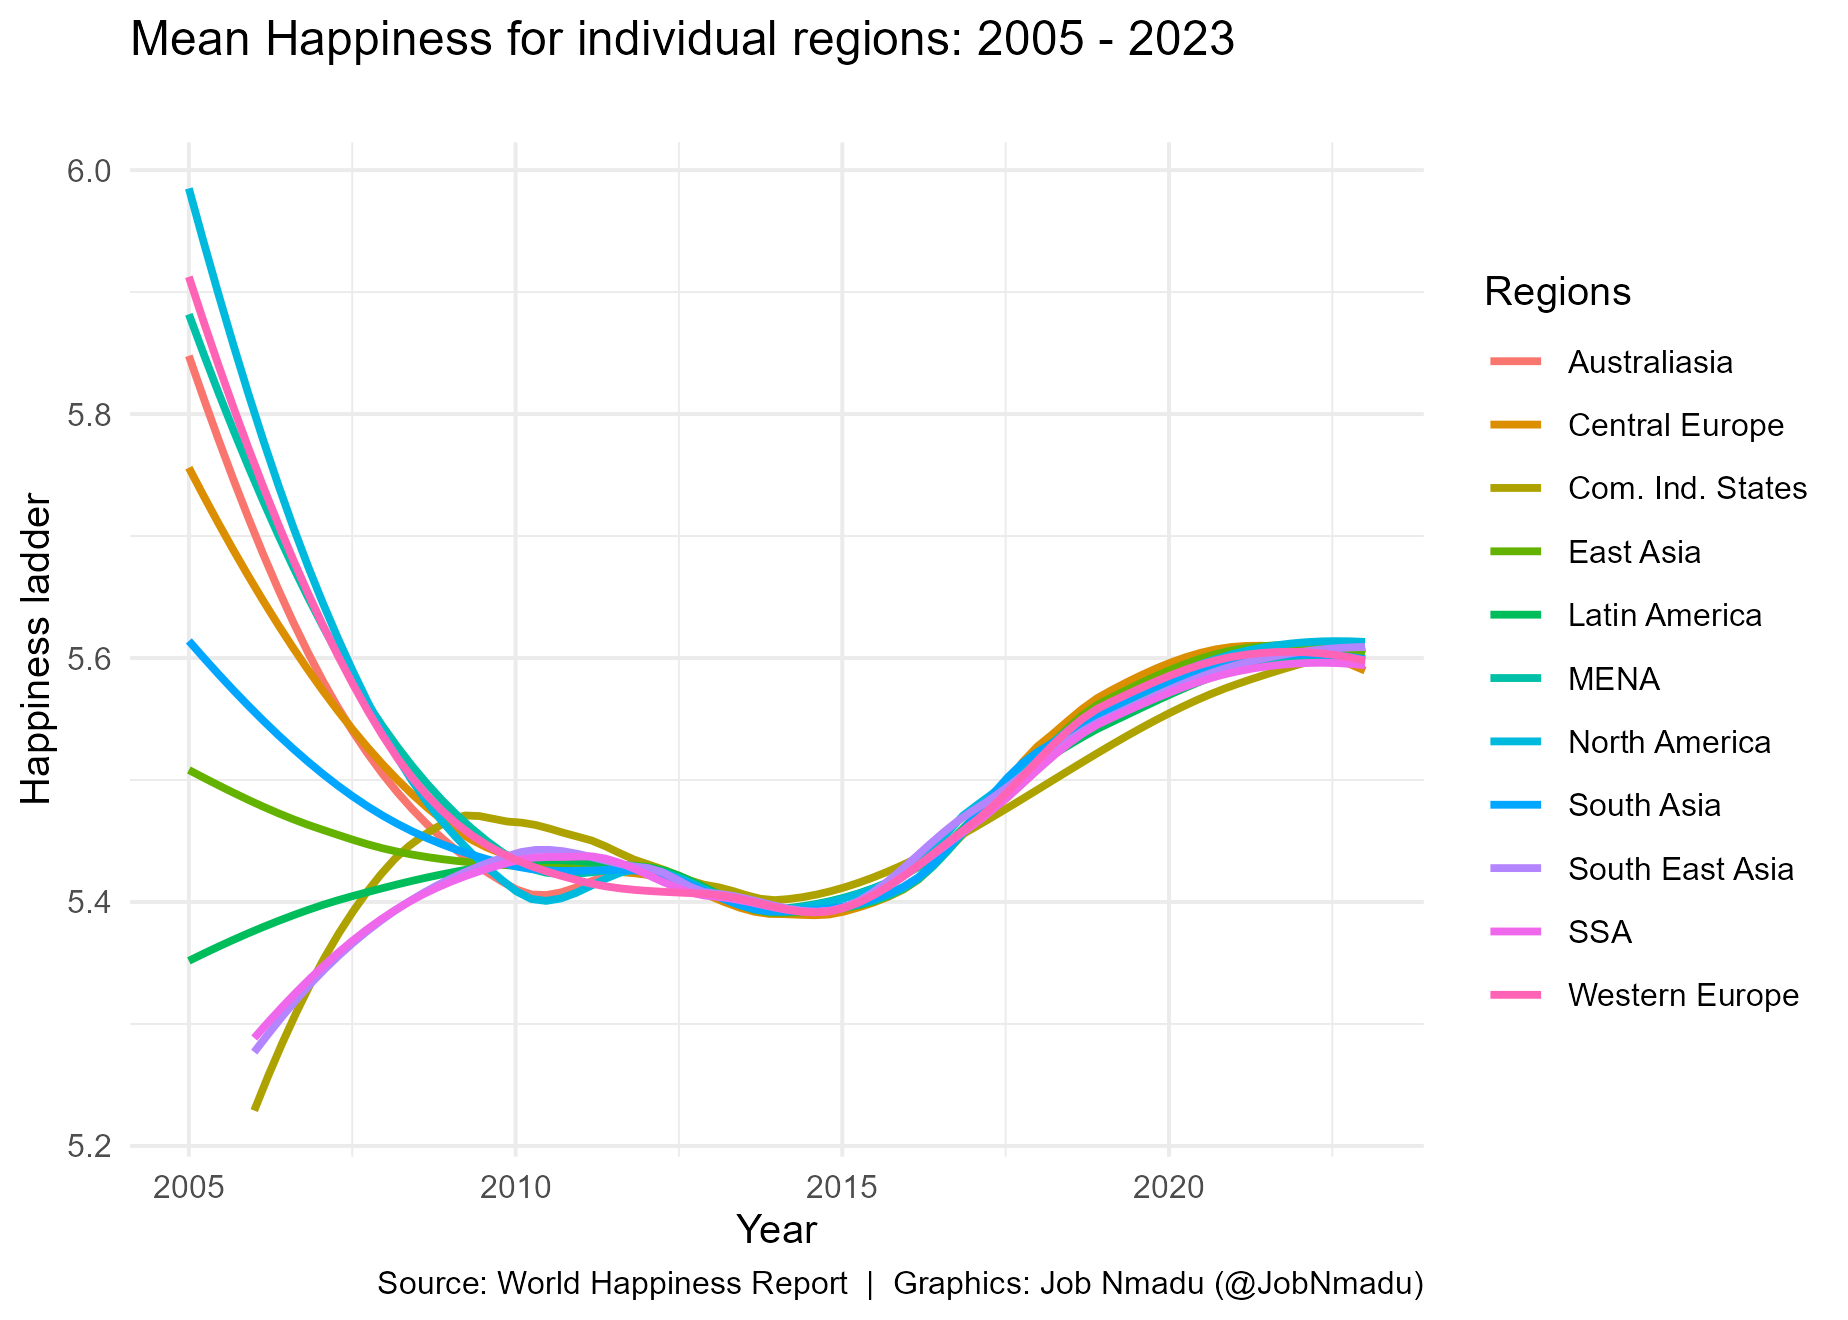
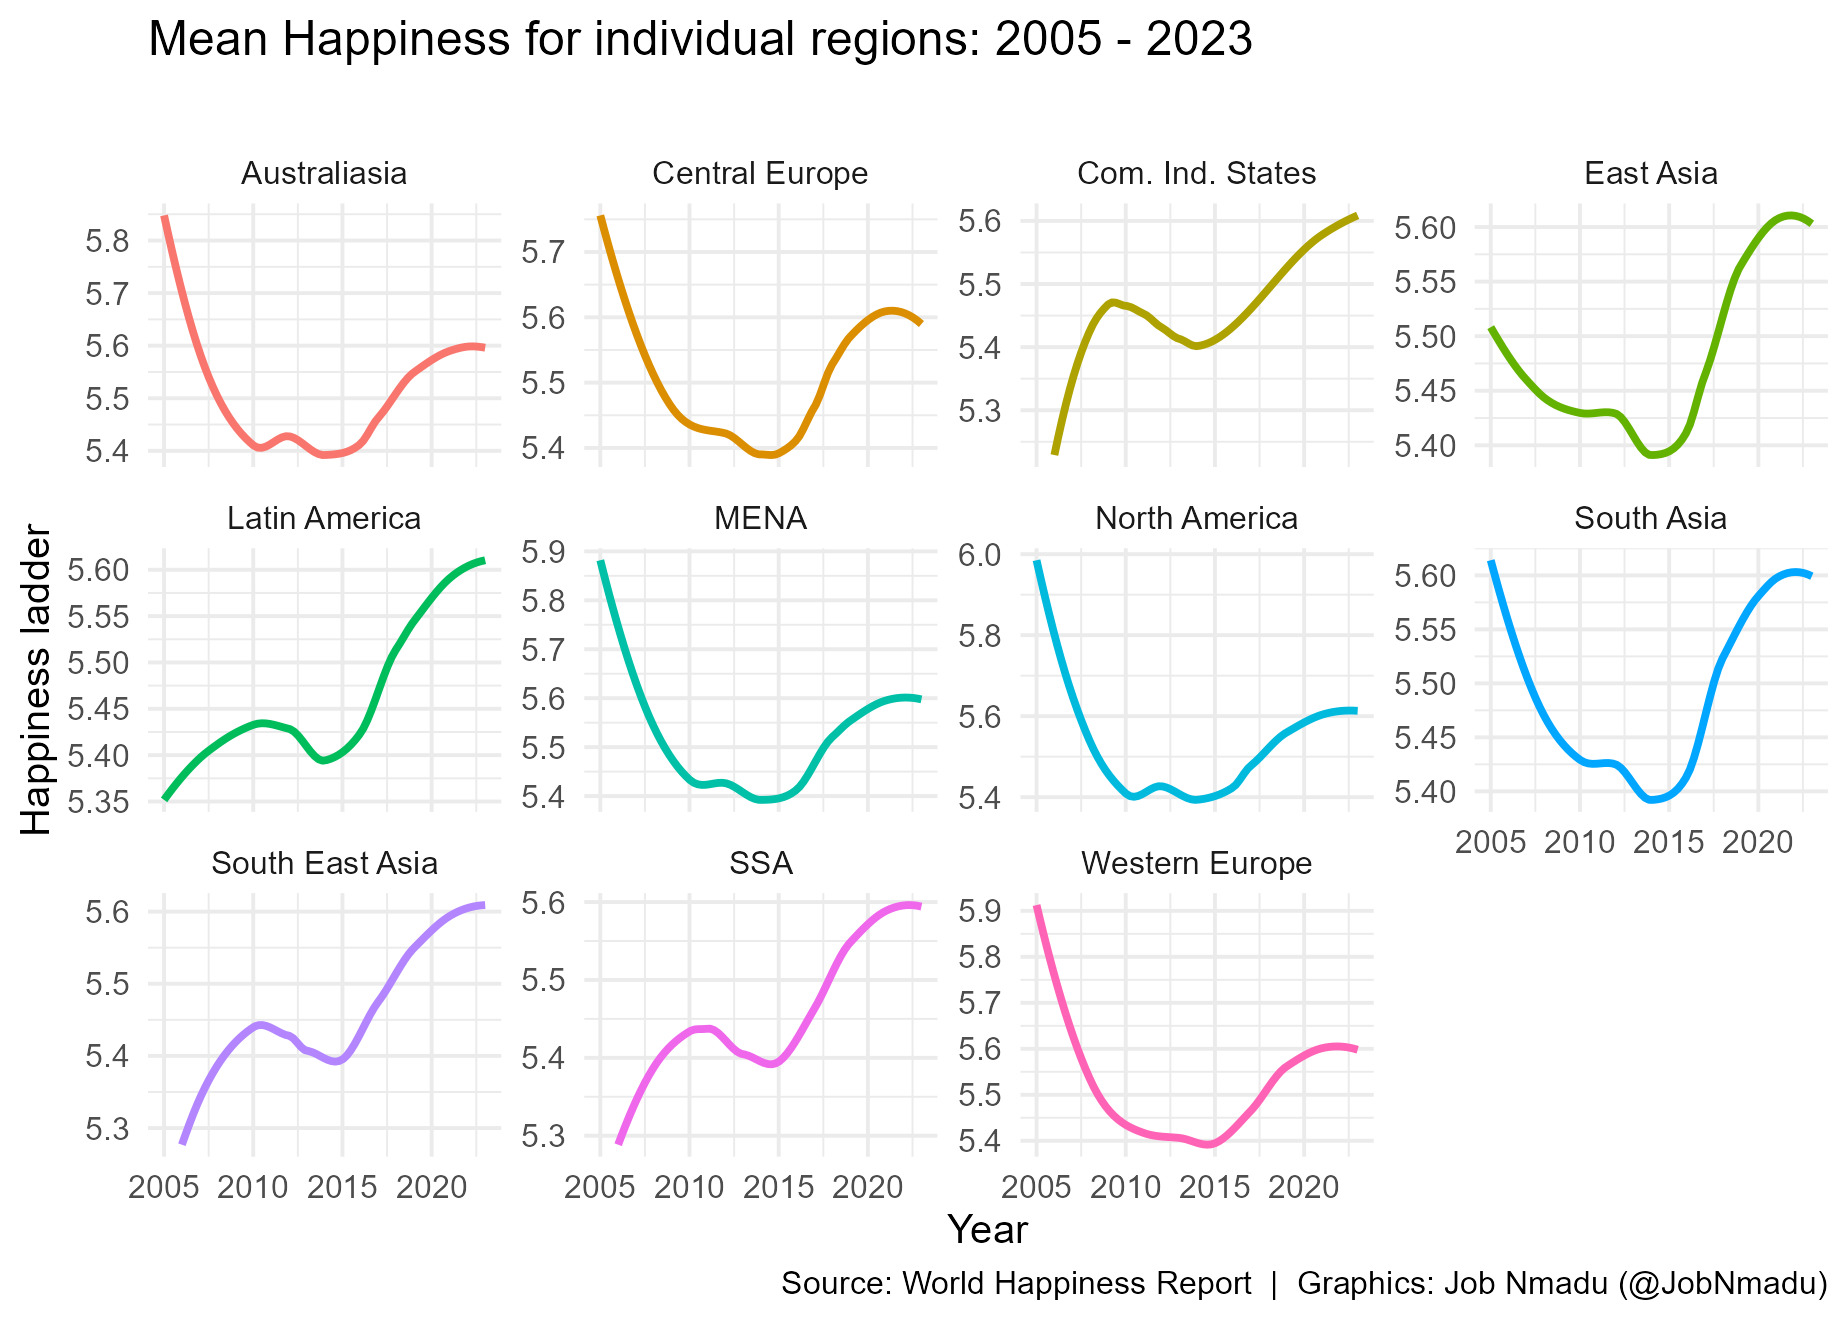
Each line is a timeseires but together, they are panel data
Factor analysis of panel global happiness ladder
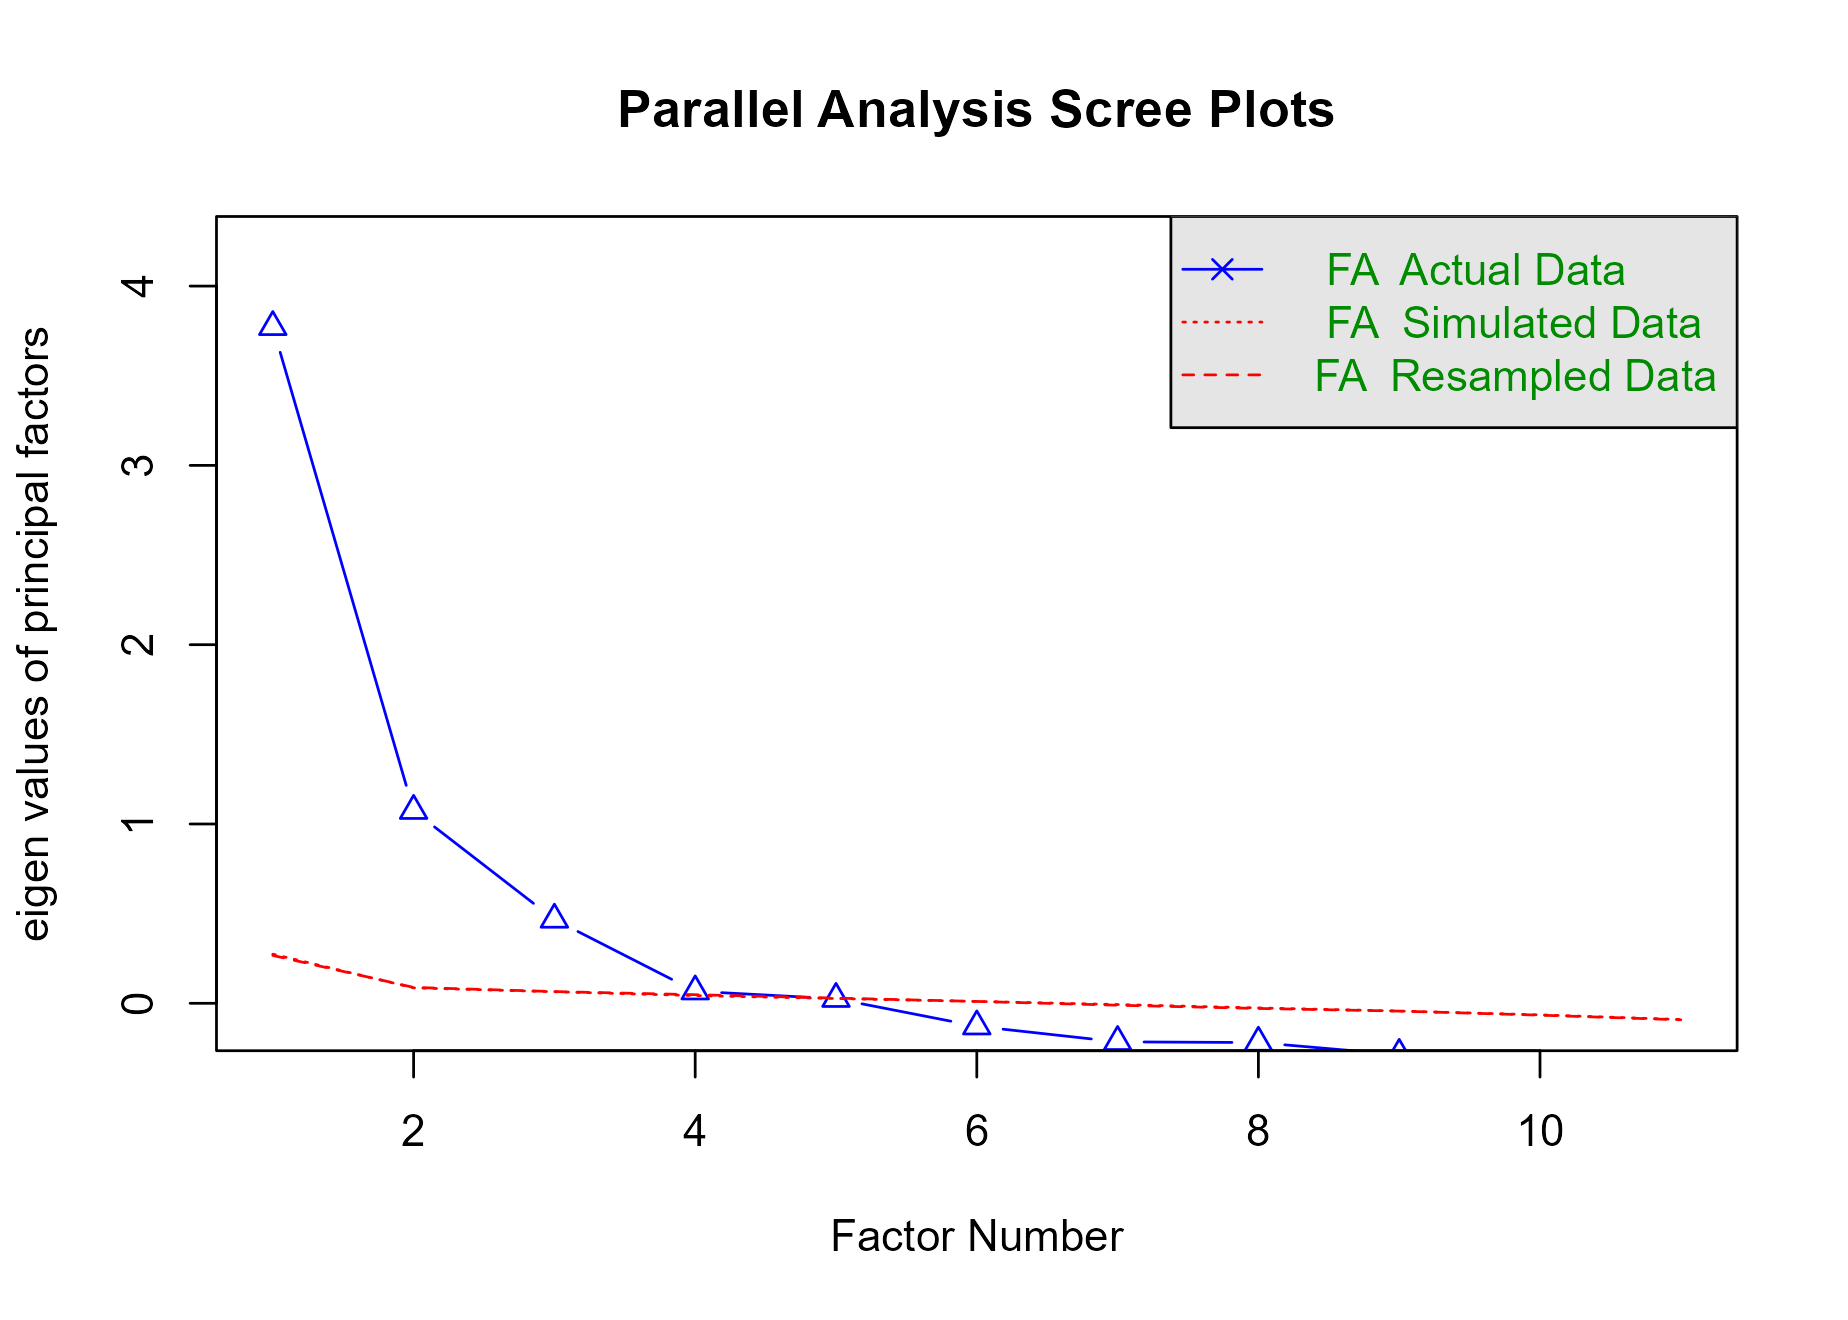
Parallel analysis suggests that the number of factors = 4 and the number of components = NA
Loadings:
           MR1    MR2    MR4    MR3
Happiness   0.810
GDP         0.899
Support     0.761
Life_Exp    0.882
Freedom            0.651
Positive           0.775
Corruption               -0.831
Negative                         0.550
Year                             0.487
Generosity         0.440
Regional

                 MR1   MR2   MR4   MR3
SS loadings    3.286 1.687 0.909 0.731
Proportion Var 0.299 0.153 0.083 0.066
Cumulative Var 0.299 0.452 0.535 0.601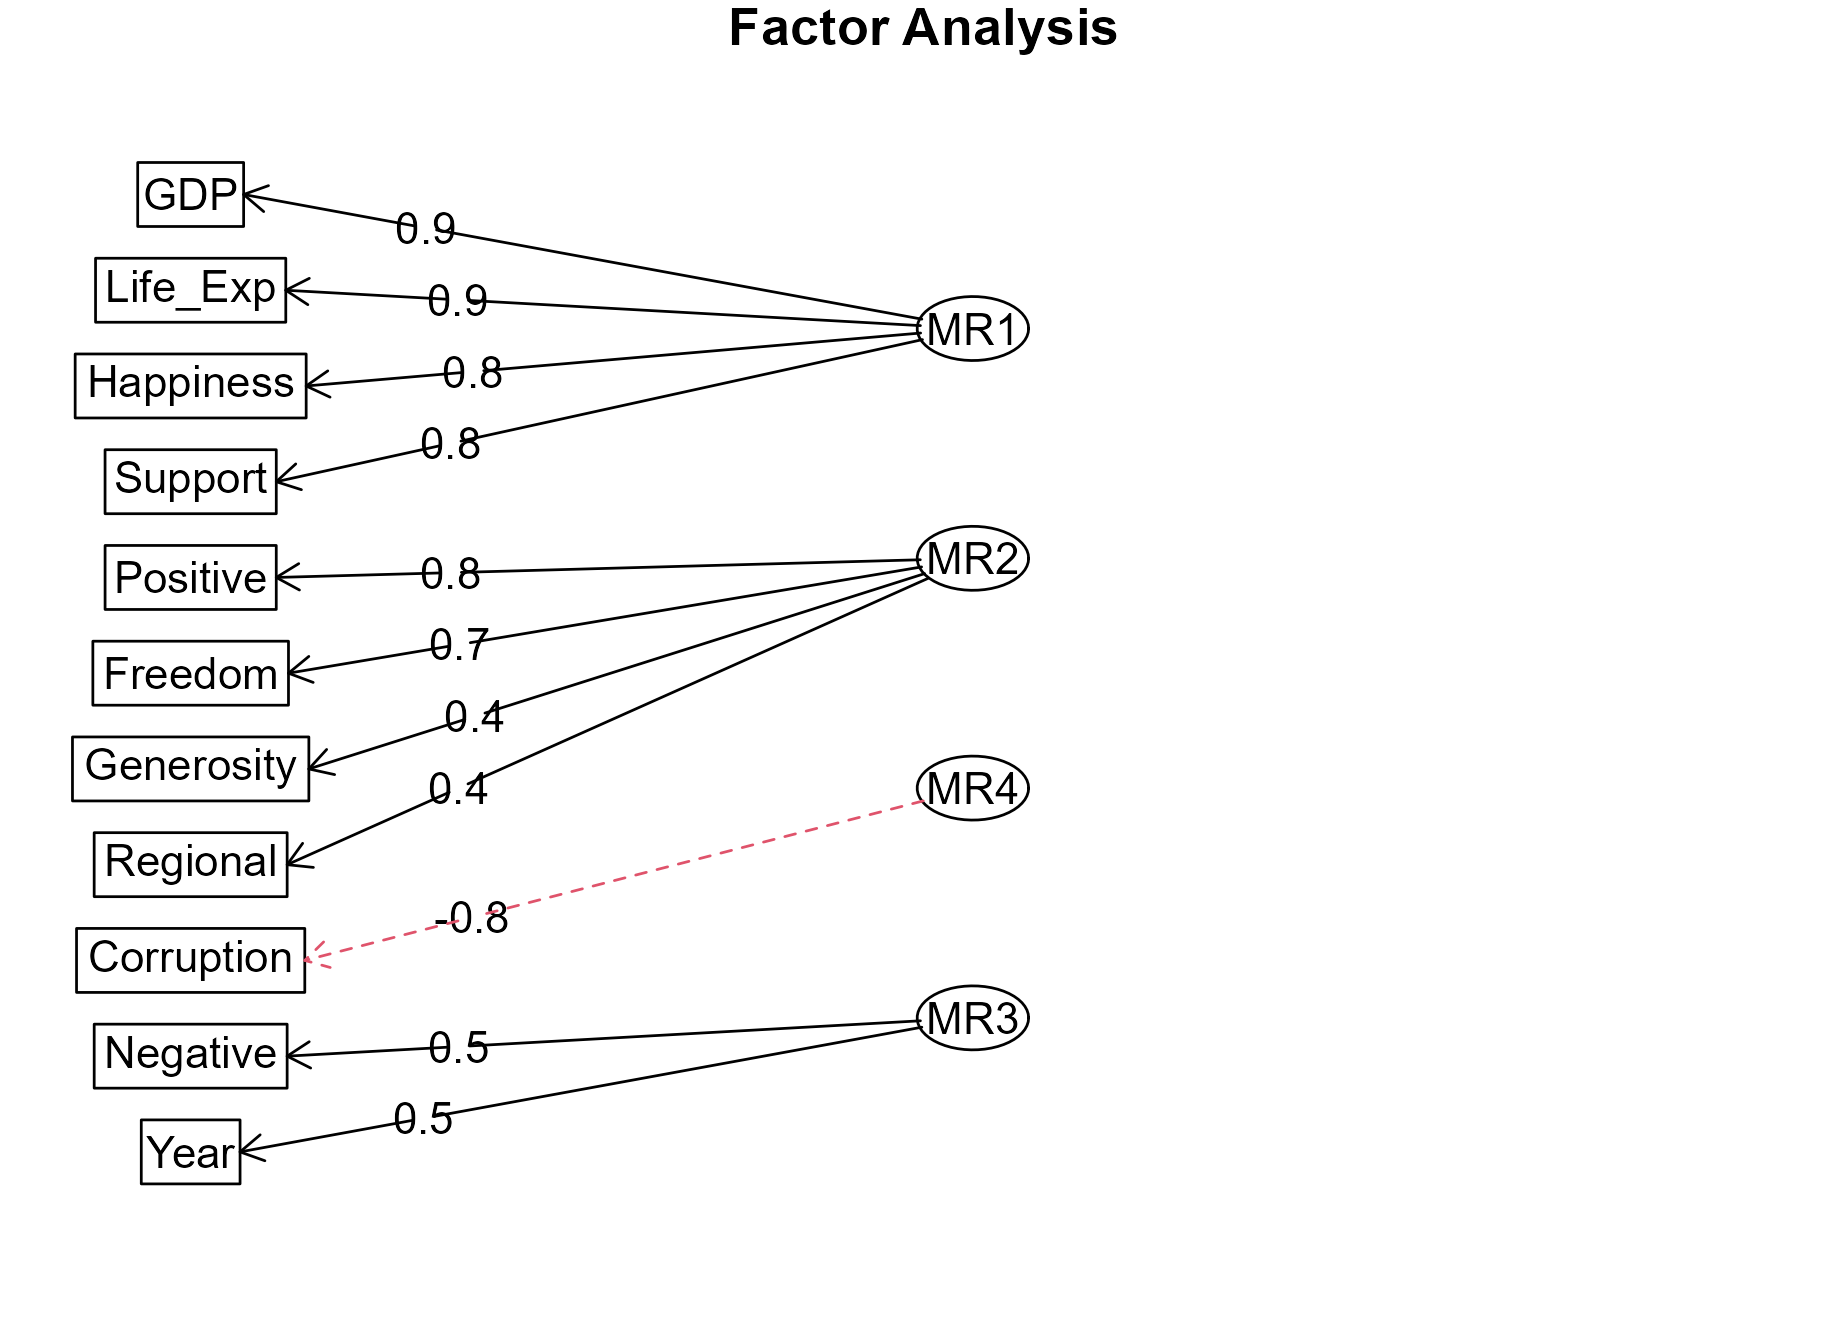
| Values | |
|---|---|
| degree of freedom | 17.00 |
| Chi-sq | 132.48 |
| Chi-sq/df | 7.79 |
| Harmonic sample size | 2298.31 |
| Root Mean Square | 0.02 |
| Probability of the empirical chi-sq | 0.00 |
| Adjusted Root Mean Square | 0.04 |
| Empirical BIC | 0.90 |
| Sample size adjusted BIC | 54.91 |
| fit (SSresidual vs SSoriginal values) | 0.90 |
| fit applied to off diagonal elements | 1.00 |
| SD of the residuals | 0.02 |
| Number of factors extracted | 4.00 |
| Number of observations | 2363.00 |
| Value of the minimised function | 0.16 |
| chi-sq based on the objective function | 369.96 |
| p-value of observing the chi-sq | 0.00 |
| chi-sq based on the objective function/df | 6.73 |
| Null model | 5.32 |
| df for null model | 55.00 |
| chi-sq for null model | 12542.24 |
| chi-sq for null model/df | 228.04 |
| Tucker Lewis Index of factoring reliability | 0.91 |
| RMSE Approximation | 0.09 |
| RMSE Approximation-lower | 0.09 |
| RMSE Approximation-upper | 0.10 |
| RMSE Approximation-confidence interval | 0.90 |
| RMSE Approximation-BIC | 237.91 |
| RMSE Approximation-empirical BIC | 291.92 |
| Mean item complexity | 1.58 |
| Kaiser Meyer Olkin Measure of Sampling Adequacy | 0.81 |
| Bartlett Chi | 12542.24 |
| Barlett p-value | 0.00 |
| Barlett df | 55.00 |
| Barlett Chi/df | 228.04 |
lavaan 0.6-18 ended normally after 117 iterations

  Estimator                                         ML
  Optimization method                           NLMINB
  Number of model parameters                        24

                                                  Used       Total
  Number of observations                          2098        2363

Model Test User Model:

  Test statistic                              2216.113
  Degrees of freedom                                31
  P-value (Chi-square)                           0.000

Model Test Baseline Model:

  Test statistic                             10727.135
  Degrees of freedom                                45
  P-value                                        0.000

User Model versus Baseline Model:

  Comparative Fit Index (CFI)                    0.795
  Tucker-Lewis Index (TLI)                       0.703

Loglikelihood and Information Criteria:

  Loglikelihood user model (H0)             -15445.704
  Loglikelihood unrestricted model (H1)     -14337.648

  Akaike (AIC)                               30939.408
  Bayesian (BIC)                             31074.978
  Sample-size adjusted Bayesian (SABIC)      30998.727

Root Mean Square Error of Approximation:

  RMSEA                                          0.183
  90 Percent confidence interval - lower         0.177
  90 Percent confidence interval - upper         0.190
  P-value H_0: RMSEA <= 0.050                    0.000
  P-value H_0: RMSEA >= 0.080                    1.000

Standardized Root Mean Square Residual:

  SRMR                                           0.110

Parameter Estimates:

  Standard errors                             Standard
  Information                                 Expected
  Information saturated (h1) model          Structured

Latent Variables:
                   Estimate  Std.Err  z-value  P(>|z|)
  MR1 =~
    GDP               1.000
    Life_Exp          5.659    0.097   58.044    0.000
    Happiness         0.931    0.016   59.736    0.000
    Support           0.089    0.002   45.585    0.000
  MR2 =~
    Positive          1.000
    Freedom           1.858    0.076   24.518    0.000
    Generosity        0.857    0.058   14.877    0.000
    Regional          7.995    1.138    7.026    0.000
  MR4 =~
    Corruption        1.000
  MR3 =~
    Year              1.000

Covariances:
                   Estimate  Std.Err  z-value  P(>|z|)
  MR1 ~~
    MR2               0.036    0.002   15.240    0.000
    MR4              -0.078    0.005  -16.353    0.000
    MR3               0.553    0.121    4.589    0.000
  MR2 ~~
    MR4              -0.007    0.000  -16.232    0.000
    MR3               0.084    0.009    9.636    0.000
  MR4 ~~
    MR3              -0.086    0.020   -4.320    0.000

Variances:
                   Estimate  Std.Err  z-value  P(>|z|)
   .GDP               0.197    0.011   17.757    0.000
   .Life_Exp         12.638    0.506   24.994    0.000
   .Happiness         0.307    0.013   24.065    0.000
   .Support           0.006    0.000   28.956    0.000
   .Positive          0.007    0.000   26.406    0.000
   .Freedom           0.003    0.001    6.186    0.000
   .Generosity        0.023    0.001   31.520    0.000
   .Regional         10.537    0.327   32.245    0.000
   .Corruption        0.000
   .Year              0.000
    MR1               1.136    0.042   27.217    0.000
    MR2               0.005    0.000   14.435    0.000
    MR4               0.034    0.001   32.388    0.000
MR3 24.675 0.762 32.388 0.000| x | |
|---|---|
| npar | 2.400000e+01 |
| fmin | 5.281489e-01 |
| chisq | 2.216113e+03 |
| df | 3.100000e+01 |
| pvalue | 0.000000e+00 |
| baseline.chisq | 1.072713e+04 |
| baseline.df | 4.500000e+01 |
| baseline.pvalue | 0.000000e+00 |
| cfi | 7.954423e-01 |
| tli | 7.030614e-01 |
| nnfi | 7.030614e-01 |
| rfi | 7.001121e-01 |
| nfi | 7.934106e-01 |
| pnfi | 5.465717e-01 |
| ifi | 7.957100e-01 |
| rni | 7.954423e-01 |
| logl | -1.544570e+04 |
| unrestricted.logl | -1.433765e+04 |
| aic | 3.093941e+04 |
| bic | 3.107498e+04 |
| ntotal | 2.098000e+03 |
| bic2 | 3.099873e+04 |
| rmsea | 1.832962e-01 |
| rmsea.ci.lower | 1.768656e-01 |
| rmsea.ci.upper | 1.898093e-01 |
| rmsea.ci.level | 9.000000e-01 |
| rmsea.pvalue | 0.000000e+00 |
| rmsea.close.h0 | 5.000000e-02 |
| rmsea.notclose.pvalue | 1.000000e+00 |
| rmsea.notclose.h0 | 8.000000e-02 |
| rmr | 1.183338e+00 |
| rmr_nomean | 1.183338e+00 |
| srmr | 1.100957e-01 |
| srmr_bentler | 1.100957e-01 |
| srmr_bentler_nomean | 1.100957e-01 |
| crmr | 1.217154e-01 |
| crmr_nomean | 1.217154e-01 |
| srmr_mplus | 1.100957e-01 |
| srmr_mplus_nomean | 1.100957e-01 |
| cn_05 | 4.358775e+01 |
| cn_01 | 5.040973e+01 |
| gfi | 8.167185e-01 |
| agfi | 6.748232e-01 |
| pgfi | 4.603323e-01 |
| mfi | 5.940683e-01 |
| ecvi | 1.079177e+00 |
| MR1 | MR2 | |
|---|---|---|
| alpha | 0.4741262 | 0.0705956 |
| omega | 0.8358631 | 0.0570646 |
| omega2 | 0.8358631 | 0.0570646 |
| omega3 | 0.8354815 | 0.0556176 |
| avevar | 0.7454058 | 0.0295963 |
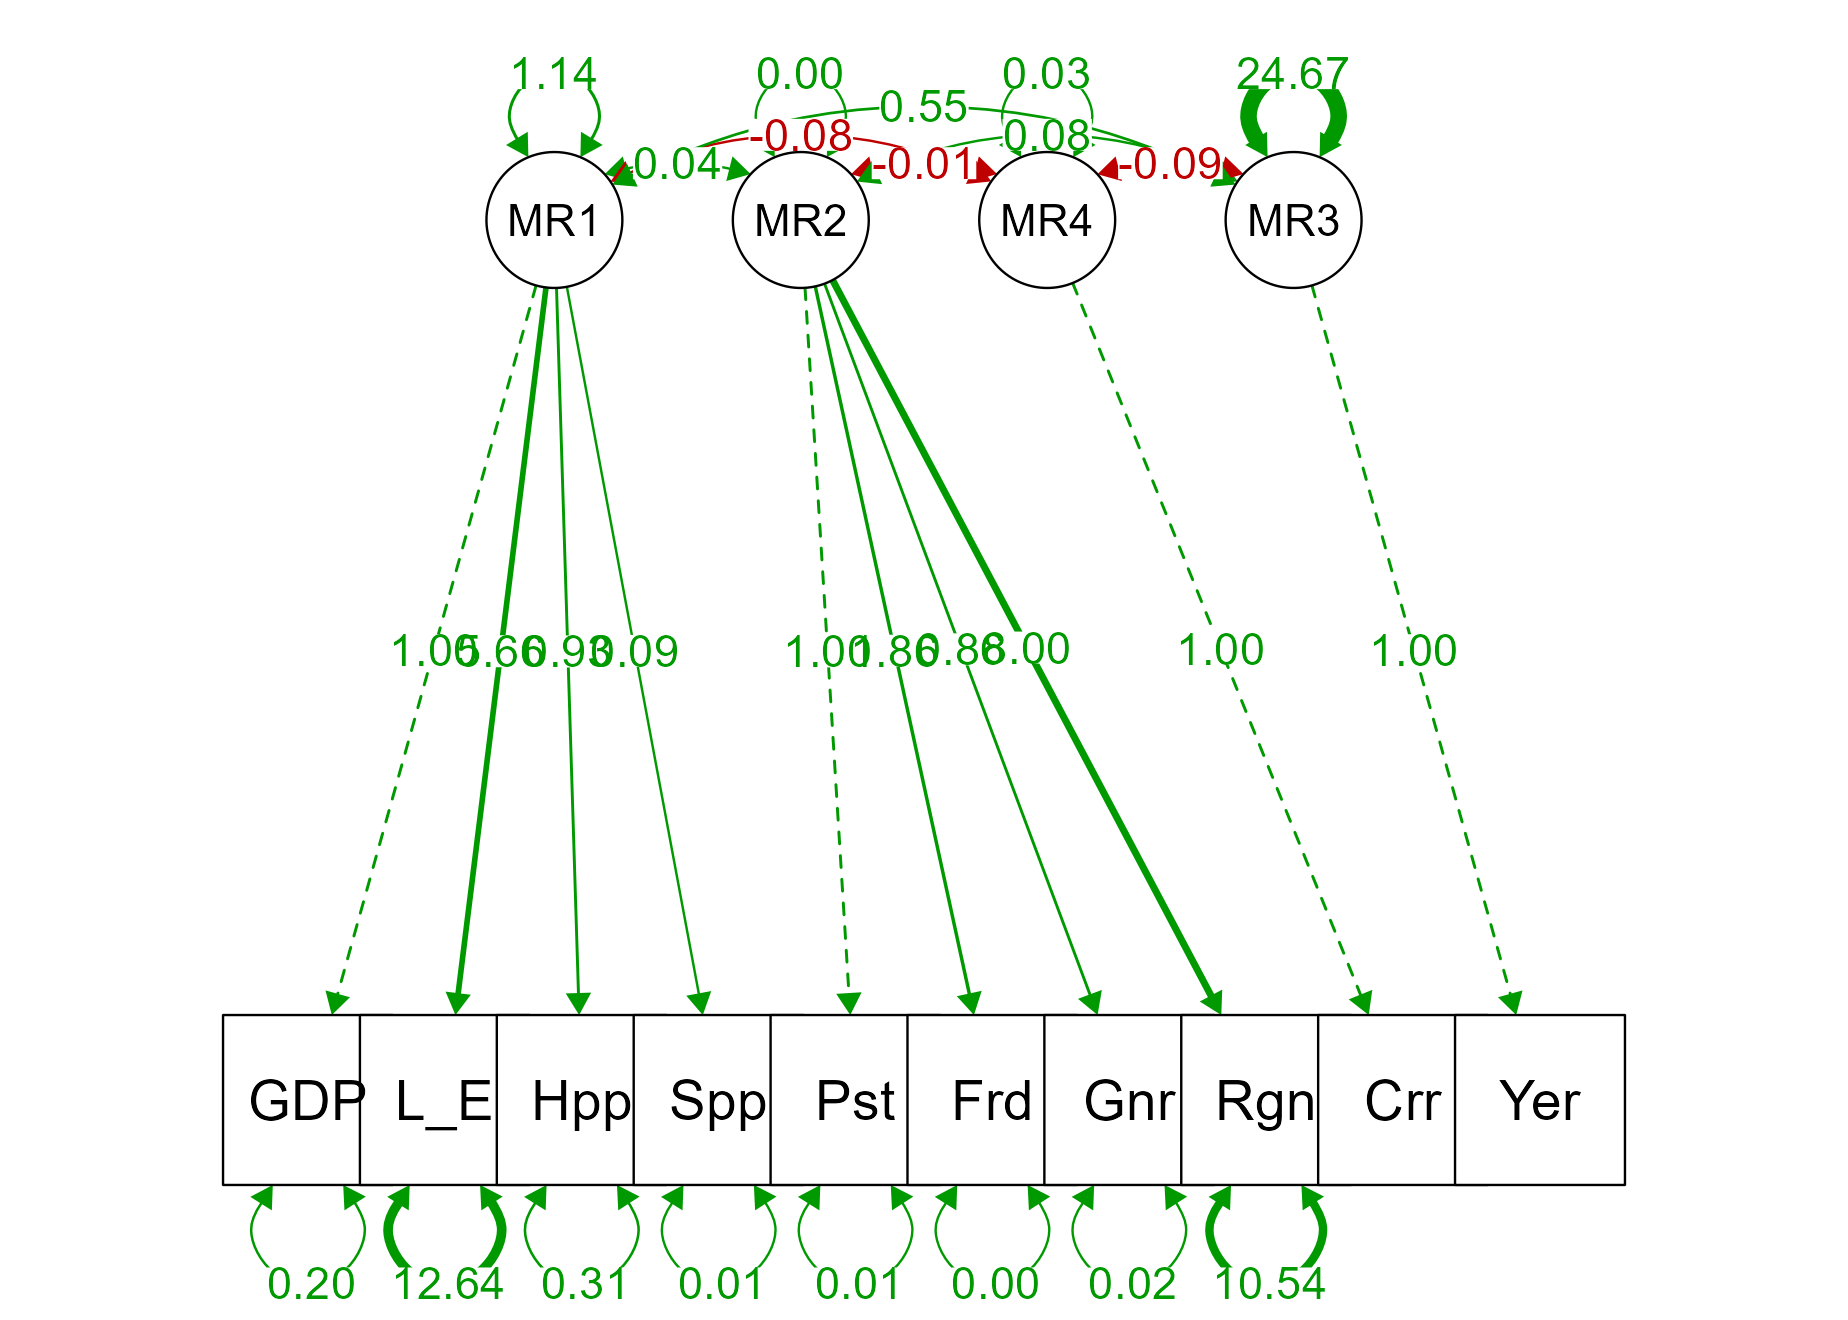
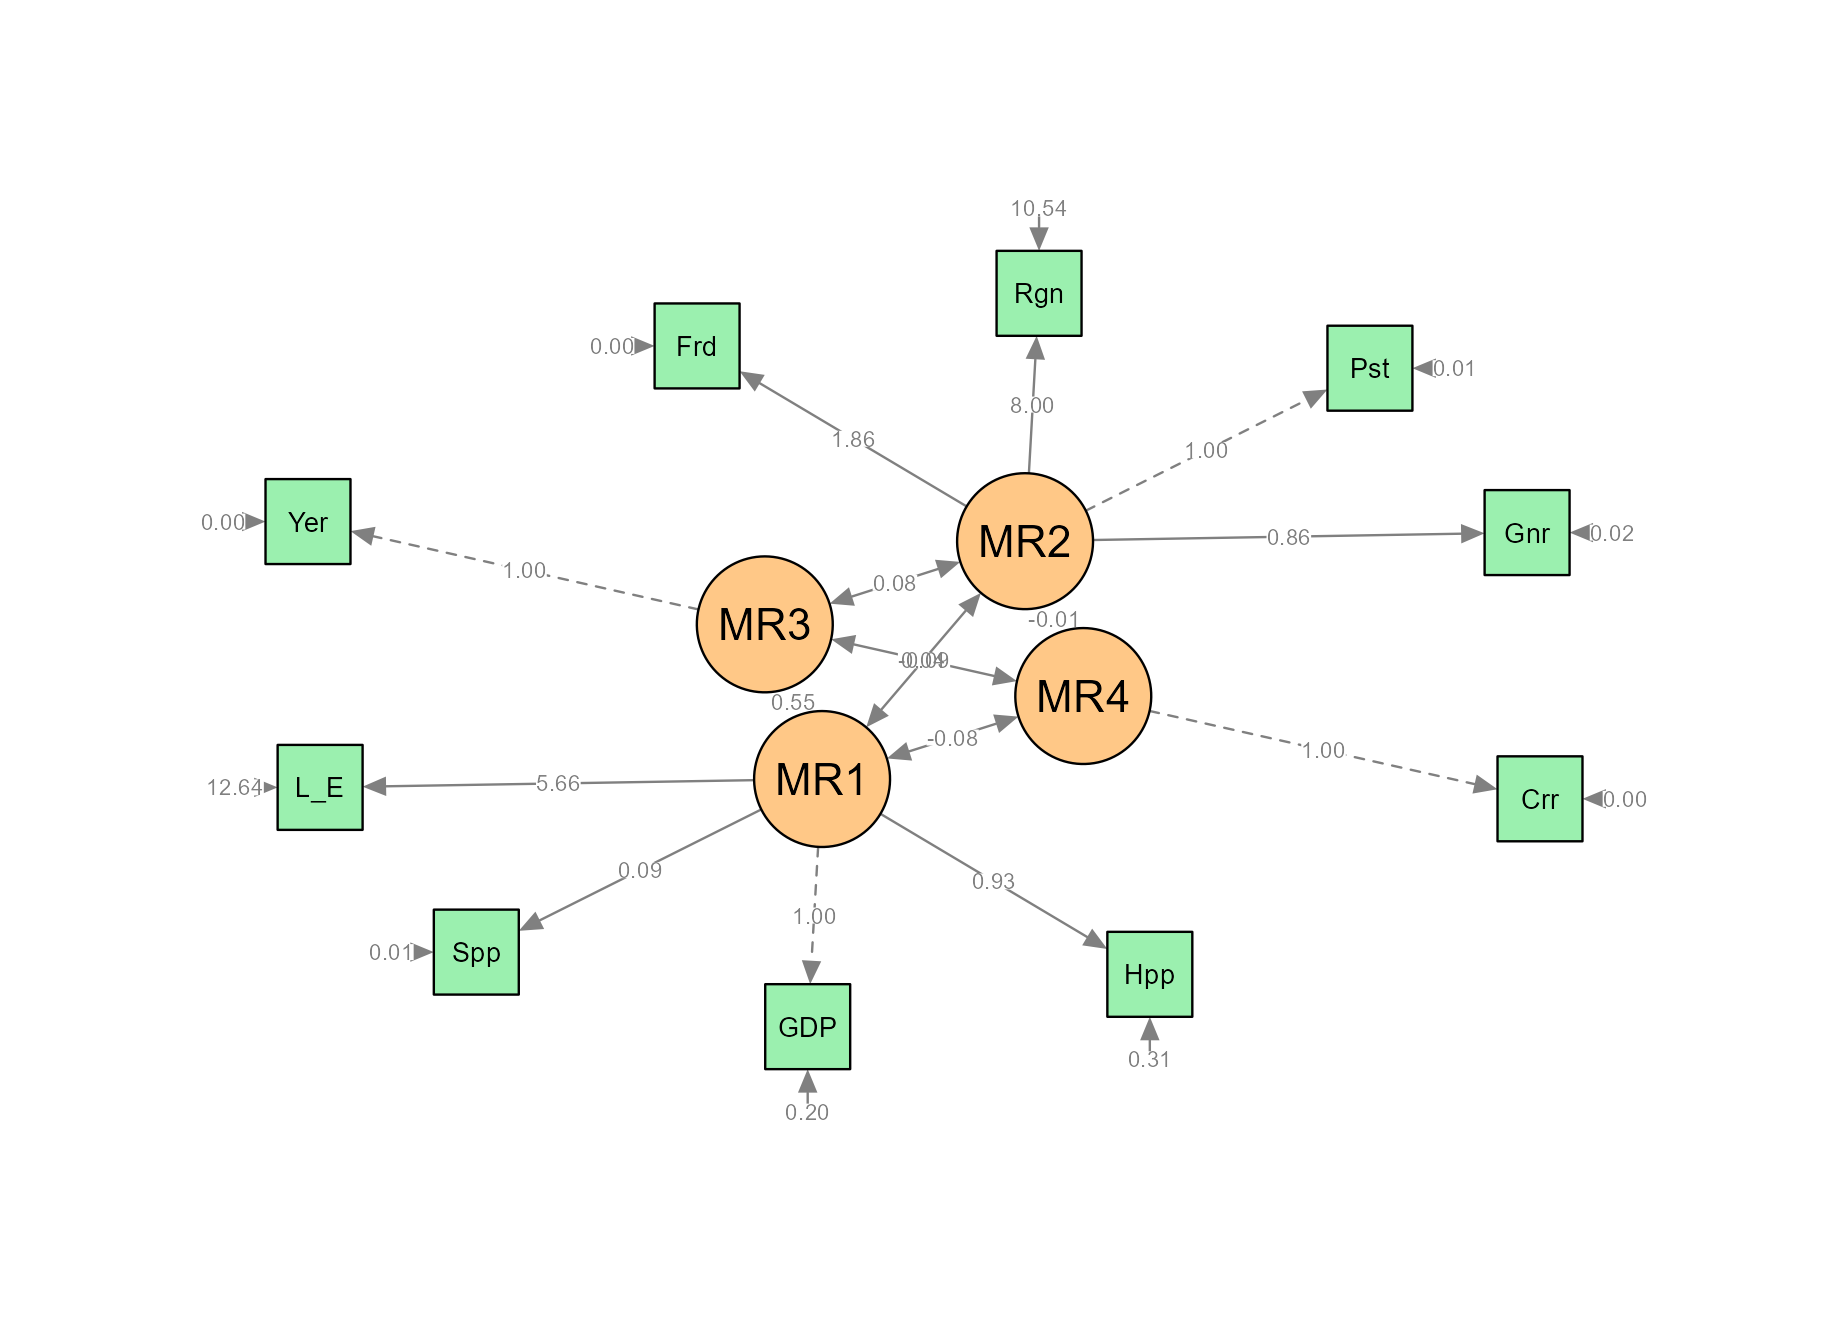
The inter-connectivity between the latent variables and the various variables used to measure hapiiness.
References
Helliwell, J. F., Layard, R., Sachs, J. D., De Neve, J.-E., Aknin, L. B., & Wang, S. (Eds.). (2024). World Happiness Report 2024. University of Oxford: Wellbeing Research Centre.